Data
Collecting data is a very important part of your experiment. Your Data Tables and Graphs will be part of your FINAL LAB REPORT. They represent the work you have done and the trials you have conducted.
There are two types of observations in data collection.
o Qualitative observations are based on your senses. These types of observations are made with words; they are descriptive and not graphed. If you collect data based on qualitative observations, it is best to organize this information into a table.
o Quantitative observations are based on measurements. These observations are recorded by using scientific tools such as rulers, timers, scales, and balances. This type of data should include a graph or pie chart.
Trials
In order for an experiment to be accepted as valid it must be tested several times. It is suggested that you test your experiment at least 3 times. If you are testing humans you must conduct at least 20 individual trials.
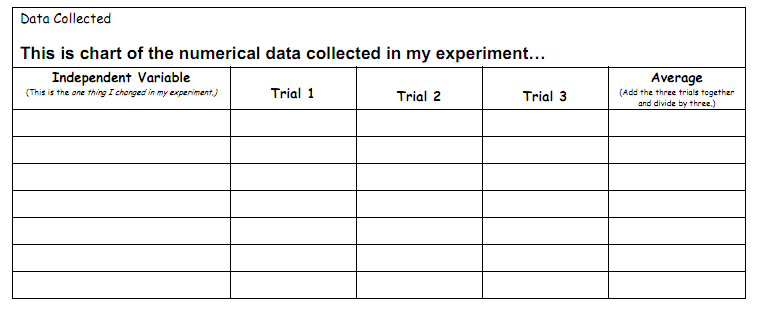
Example of a data table:
A data table is a chart that organizes information into columns and rows. All tables should have a title; if you have measurements be sure to include the units of measurement.
There are two types of observations in data collection.
o Qualitative observations are based on your senses. These types of observations are made with words; they are descriptive and not graphed. If you collect data based on qualitative observations, it is best to organize this information into a table.
o Quantitative observations are based on measurements. These observations are recorded by using scientific tools such as rulers, timers, scales, and balances. This type of data should include a graph or pie chart.
Trials
In order for an experiment to be accepted as valid it must be tested several times. It is suggested that you test your experiment at least 3 times. If you are testing humans you must conduct at least 20 individual trials.
Example of a data table:
A data table is a chart that organizes information into columns and rows. All tables should have a title; if you have measurements be sure to include the units of measurement.
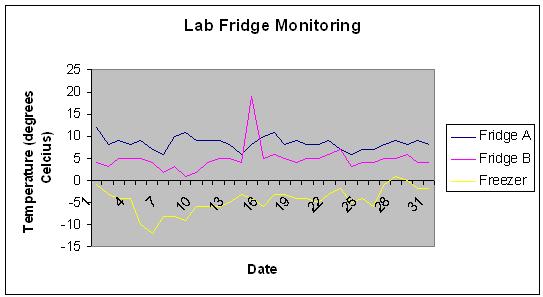
Graphing
Graphing data is a way of showing how the two variables are related, or the relationship between the manipulated and responding variables. The X-axis of a graph is generally the manipulated variable; the Y-axis of a graph is generally the responding variable.